At first glance this blog seems to contain a wealth of information regarding weather phenomena described using copious amounts of meteorological jargon. However, prior to this class I had no background in weather. Therefore, it's helpful to understand the basic concepts that I obtained throughout the class that explain many of the posts and assignments in this blog. Here are just a few concepts that should aid in understanding the information presented here.
Surface Maps
Surface maps are an almost daily occurrence in the daily weather blog posts. But how is one read? Here are the basics using the surface map in figure 1.
 |
| Figure 1. Surface map of the United States. |
This map is from NOAA National Weather Service, a great resource for weather information. One of the main parts of a surface map is the front lines. There are four types, warm, cold, occluded, and stationary. The most common are warm and cold fronts. The warm fronts are red with half circles and the cold fronts are blue with triangles. The circles or triangles point in the direction the wind is blowing
to. On the map in figure 1, there is a cold front moving over Wisconsin and Iowa that is denoted by the blue line and triangles. The wind is blowing to the southeast, which is also the direction the front is headed.
The other major portion of a surface map is the high and low pressure systems. As the name suggests, these are either areas of high pressure or low pressure. High pressure systems are associated with colder, denser air that increases pressure and low pressure systems are associated with warmer, less dense air that decreases pressure. Precipitation events are likely found with a low pressure system because the air is moist and there is lifting of the air into the atmosphere. On the map, a low pressure system is situated just to the east of Colorado and moving into Oklahoma. This surface map outlines areas of certain types of weather and in this case there are severe thunderstorms and a chance for flooding that are products of the low pressure front moving through.
With these concepts in mind, surface maps are easily read and can provide basic weather information.
Stuve Diagrams
For those who want a challenge, understanding a stuve diagram is another way to obtain weather information. Although saying "weather information" may be a bit misleading. Stuve diagrams provide information about the moisture content of the air and the conditions needed for things such as adiabatic lifting to occur. These in and of themselves will not give you a description of the weather. However, if one knows what the values obtained from the stuve diagram indicate, then they can be used to understand what weather phenomena are occurring.
If you're interested, visit exercise 2 in the exercises and labs link of this blog. Exercise 2 explains some basic readings that can be obtained from the diagrams and thus they won't be repeated here.
Air Masses
Occasionally an air mass will be mentioned in the blog such as the continental polar. But just what do I mean by "continental polar?" This concept was covered in a previous exercise, but I'll repost it here for good measure (figure 2).
 |
| Figure 2. Map with labeled air masses in North America. |
Each air
mass is labeled with a blue circle. The characteristics of each air mass
are listed in light brown boxes. The direction of the air masses are
labeled with various colored arrows.
Each air mass labeled on the map has distinct characteristics that all play a part in the weather experienced in the United States. The continental arctic and polar
air masses originate in the arctic and spill down across Canada and into
the northern United States in the winter. The maritime polar (Pacific)
affects the west coast including Washington and Oregon. The maritime
tropical Pacific, Gulf, and Atlantic all originate in the south and head
up towards the southern United States. The continental tropical also
originates in the south and heads upwards but like the continental
arctic and polar its air mas sis dry. The maritime polar (Atlantic) is
similar to the maritime polar (Pacific) but affects the northeastern
coast of the U.S.
In general, cold, dense air comes from the continental polar and sometime the continental arctic air masses. The moisture that feeds many of the storm systems in the United States comes from the maritime tropical air masses that are also warm. Knowing these air masses helps in understanding what causes the weather systems seen in the country.
Wind Maps
Normally when someone wants to know what the weather is like, they will open up their computer or take out their phone to determine the weather conditions. But sometimes these resources are not available and so another source must be used. One of the these is wind direction. I will be specifically focusing on the Wisconsin-Minnesota area, but wind direction can be applied to any location if one knows the general weather trends of the area.
 |
| Figure 3. Wind map of the United States. |
In the wind map, one can see the counterclockwise motion of the wind over Wisconsin, which is indicative of a low pressure system. But how does this apply when I'm outside? Yesterday before the front came in, winds were mainly out of the S/SW. In this area, that indicates warm, moist air from the south which means some type of precipitation is on the way. This was apparent yesterday when the low pressure system was to the west of Wisconsin. On the other hand, if winds are out of the N/NW, then there likely won't be any precipitation or storms because cooler, drier air comes from the north. Again, this is for the Minnesota/Wisconsin area. Other parts of the country experience different winds and different air masses that affect the weather that they see.
Clouds
In addition to looking at wind direction, the cloud types in the sky can also indicate the type of weather an area will see. I will outline a few examples here.
 |
| Figure 4. Warm front cloud progression. |
|
If warm fronts bring precipitation events, then knowing how the clouds change as a front is approaching can help in predicting when a storm will come. A caveat here is wind direction. Sometimes clouds within this progression will be visible but if the wind direction isn't the primary direction of weather for an area (such as southerly winds for Wisconsin) then the clouds might not be predicting storms. In general, as a warm front approaches the clouds will shift from cirrus to cirrostratus to altostratus to nimbostratus, at which point rain will be falling.
 |
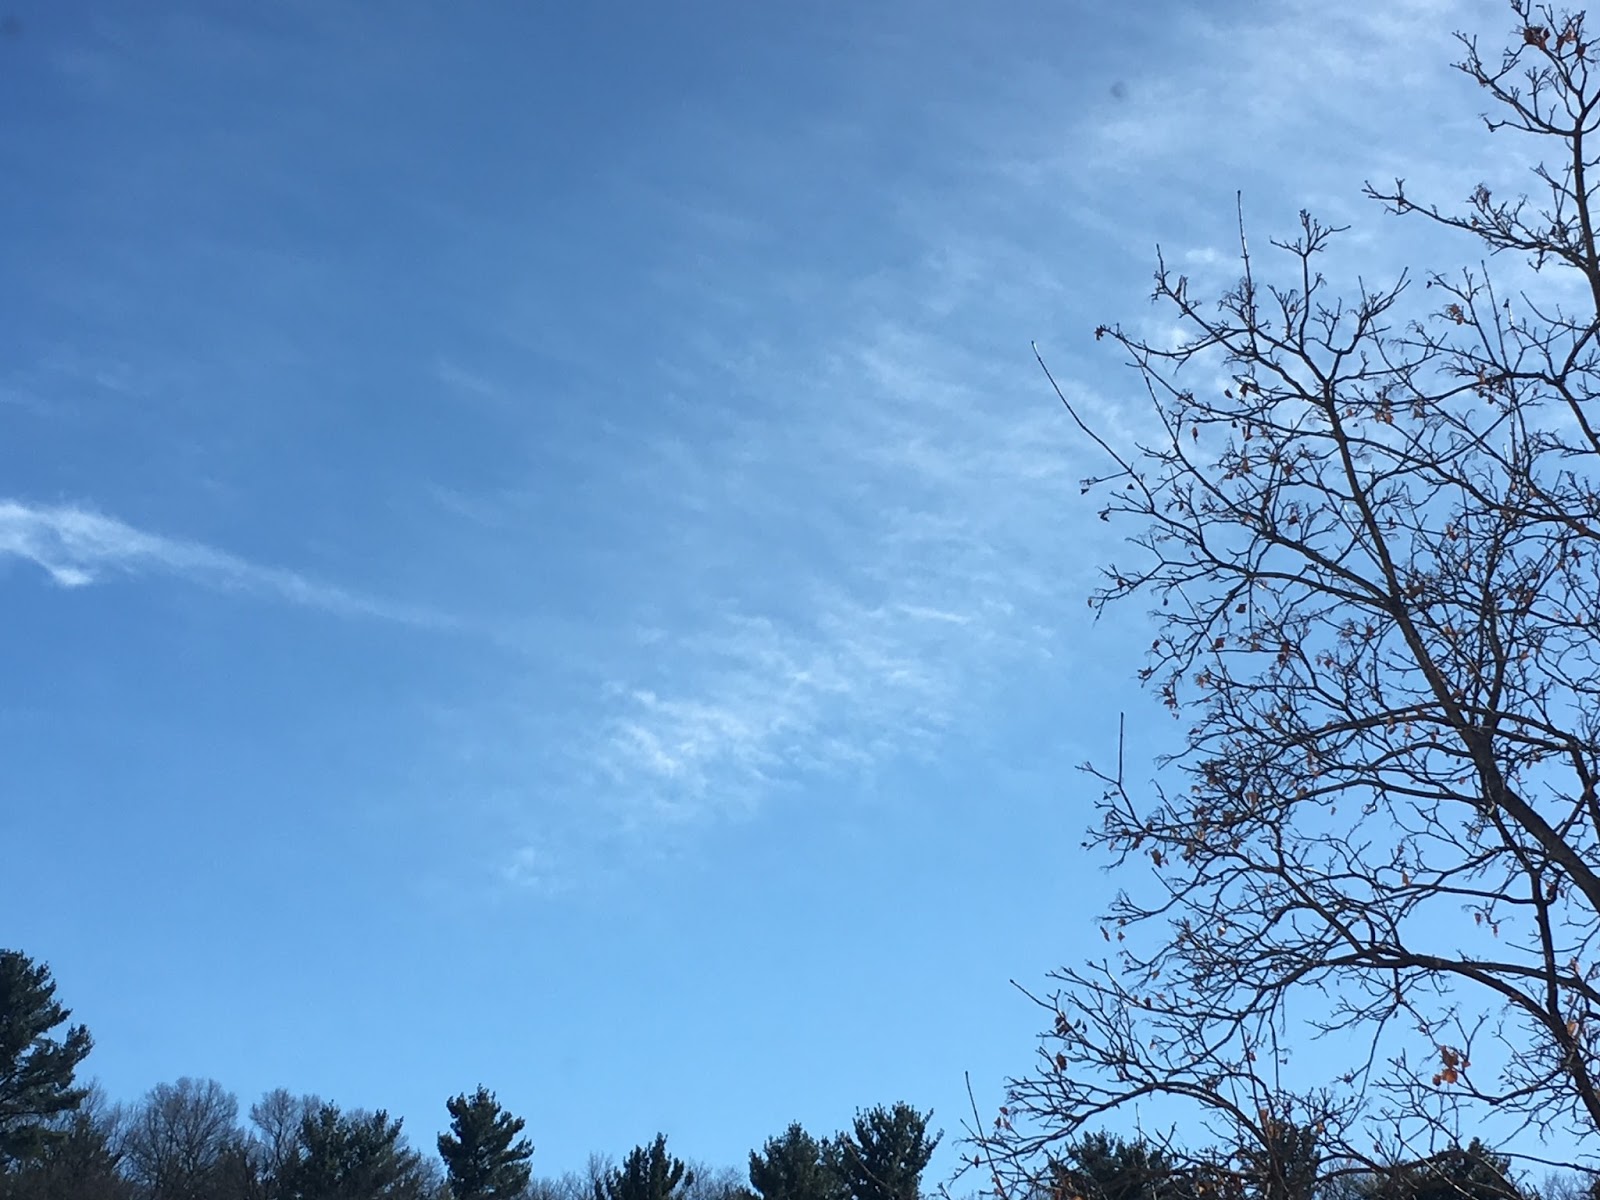
| Figure 5. Cirrus Clouds. |
In figure 5 one can see some cirrus clouds. If the winds are N/NW as they were when the picture was taken, they predict good weather in the future.
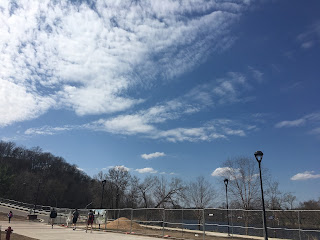 |
| Figure 6. Altocumulus clouds in the foreground and cumulus humilis clouds in the background. |
Again, the prediction based on the clouds in figure 6 depends on wind direction. If the winds are S/SE and the clouds progress to stratocumulus and finally stratus, then precipitation is on the way.
Speaking of cumulus clouds, the progression of cumulus clouds can indicate stronger thunderstorms. The first cumulus clouds shown in figure 6 are cumulus humilis. These have a longer horizontal axis than a vertical axis. Then comes cumulus mediocris, which have a longer vertical axis than horizontal axis but are still appreciably small (figure 7).
 |
| Figure 7. Cumulus mediocris courtesy of EPOD Universities Space Research Association. |
The last two stages are cumulus congestus and cumulonimbus (figure 8 and 9).
 |
| Figure 8. Cumulus congestus courtesy of flickr. |
 |
| Figure 9. Cumulonimbus courtesy of pinterest. |
Cumulus congestus have begun major vertical growth but have not hit the troposphere yet which creates the anvil shape of the cumulonimbus. The cumulonimbus are the large, anvil-shaped clouds that create thunderstorms.
Finally, it is important to know that most times the sky will be mixed like the picture in figure 10.
 |
| Figure 10. Mixed sky. |
In this case there are multiple cloud types that must be carefully analyzed before predictions can be made.
I hope these descriptions provide at least a little background to weather that can help you become a better weather forecaster than you were before.